Author: Derek Cunningham
Abstract – In a recent study by the author it was determined that the lines found within ancient geometric images (from early religious and astronomical sites) are aligned to specific angles, and the structure of Palaeolithic geometric patterns are not random artistic doodles, but instead are aligned to match astronomical values. Within the prior study, the measured p-value was measured to be very low, with a value below 1.08×10-46. However, because the prior study by the author was the first large-scale study to analyse the angles present in ancient images, there still remains some criticism. Therefore, in this study, to confirm the prior analysis is valid, the data reanalysed with the error bar in the measurement of the angles of the lines now increased from the prior ±0.5° limit to an accuracy of ±3°.(note this degree of error was seldom seen in the actual study of the lines). Through increasing the error bars to this low resolution the maximum number of peaks that can theoretically be seen within a 45 degree window is now reduced to just 15, which is less than the number of distinct peaks that is actually seen in practice. This permits an analysis of statistical probability to be undertaken in what would be the worst-case scenario. However, despite artificially decreasing the angular resolution of the data, this reanalysis of the data still reveals the Null-hypothesis entirely fails, and the data remains consistent with the lines being generated with deliberate intent. It is thus argued that if the lines are not random, and were designed with intent, the lines must be an archaic form of text.
Introduction
Within the field of archaeology it has long been argued that all the geometric patterns found at all ancient sites are just random doodles, and they are just examples of images created by bored Stone Age children and adults. Because of this, it is thus argued, within mainstream publications, that there can be no meaning contained within these ancient lines, and any attempt to describe the geometric patterns as writing is just wishful thinking.
However, within recent years some movement from this position has become noticeable. A publication in New Scientist argued the curved geometric lines seen in Lascaux Cave might be a type of proto-writing, and it is possible that the lines and the various marks (within the Lascaux Cave) were deliberate attempts to represent the number of months for animal pregnancies1.
The problem is, until recently, there has been almost no scientific interest in studying these geometric lines. For example, Genevieve von Petzinger, in her attempt to explain the presence of various common marks around the world, she describes the lines as being symbols, but she stops short of calling them a form of writing, and also routinely refers to them as being art. Genevieve von Petzinger also noted that when she was a student her professor mentioned that there was no database that systematically recorded all these symbols. Thus von Petzinger decided to begin to compile a database to fill this gap3. However, even though this database would appear extremely helpful in researching the angles present within ancient drawings; von Petzinger, unfortunately, refused to make the database open for this work.
Thus the analysis of ancient geometrics is currently restricted to images where the angles can be verified, or published images of geometric patterns that have been published by archaeologists, and by museums, and the site can be reasonably identified with either probable ancient religious use, or there was a link to astronomy. The complete list of the images analyzed is provided the author’s prior study (see here) and is not reproduced here.
In the authors prior studies of ancient angular lines4,5,6, it was argued, and it is now apparently confirmed6 that these lines represent a specific range of astronomical values, with the most common angles representing the astronomical values that are critical for accurately measuring time, and for predicting future solar and lunar eclipse events.
However, it is claimed that one potential problem in the statistical study6 (which revealed that two independent classes of geometric patterns generated two identical line distributions) is the analysis failed to consider the effect of increasing the width of the error bars in the measured angles.
As can be imagined, many images are ancient, and with erosion it is possible that there might be errors in reading the angles that exceed the ±0.5° error that was chosen in the prior study – here it should be noted that from personal experience the standard error was usually close to ±0.3°. However, it is required to analyse teh worst-case scenario. Therefore, in order to determine if decreasing the perceived accuracy of the lines could result in a different conclusion, it was decided to reanalyse the data, with the error in reading each angle increased to ±3°, which is substantially above the error seen in most case studies. Typically, errors of this magnitude can only be seen within short, thick lines, which, being short, and difficult to measure were not included in the prior studies4,5. This means this specific study is for the most part theoretical in nature, and again is only done to determine a worst case scenario.
Results
Through increasing the error bar used for reading the angles to ±3°, the immediate effect is to reduce the number of regions where a line can be observed to 15. This is because, within the proposed theory, it is argued that the angles of the lines are offset to either the left or right of vertical, or to above and below the horizontal. This divides the circle into four quadrants and it permits the angle of the line to determine the sound of a consonant, and the direction of the line to generate a linked vowel (with four directions the attached vowels could be a e/i, o and u; or a/o, e, i and u.). This creates an alphabet that is similar to modern day Japanese Hiragana or Katakana4-6.
With the number of lines theoretically reduced to just 15, this number being lower than the number of peaks actually observed – see Fig. 1 and Fig. 2, which show the angles observed in geometric images that have fixed orientation and for patterns that are mobile and can be rotated6.
This means this proposed analysis increases the error bars to beyond the angular resolution actually seen, and if it was actually implemented it would have had the effect to combining the 5.1 and 6.511 degree lines together and also it would join the 22 and 23.6 degree lines together.
However, the most important effect this would have on the statistical analysis, is a reduction in the number of possible peaks, will reduce the number of possible combinations in combination probability calculations. This is beneficial for the Null-Theory, which argues the lines are random.
To explain further, within the prior study6, the purpose of the experiment was to determine, using combination and probability theory, the probability that the observed lines are random. This was done by comparing the data obtained from two entirely independent datasets. If the Null-theory (the lines-are-random theory) is correct, as is currently accepted in mainline archaeological journals, then it is obvious that the distribution plots for the two independent datasets should be random, and if any overlaps are seen, then it should be possible to determine what the chance is that any observed overlap is just the result of chance.
The two independent datasets are shown below, and were compiled from (a) an analysis of a large array of images that could not be rotated (fFg.1.) and (b) a large array of images that have been found on objects that could be picked up and rotated (Fig. 2.)
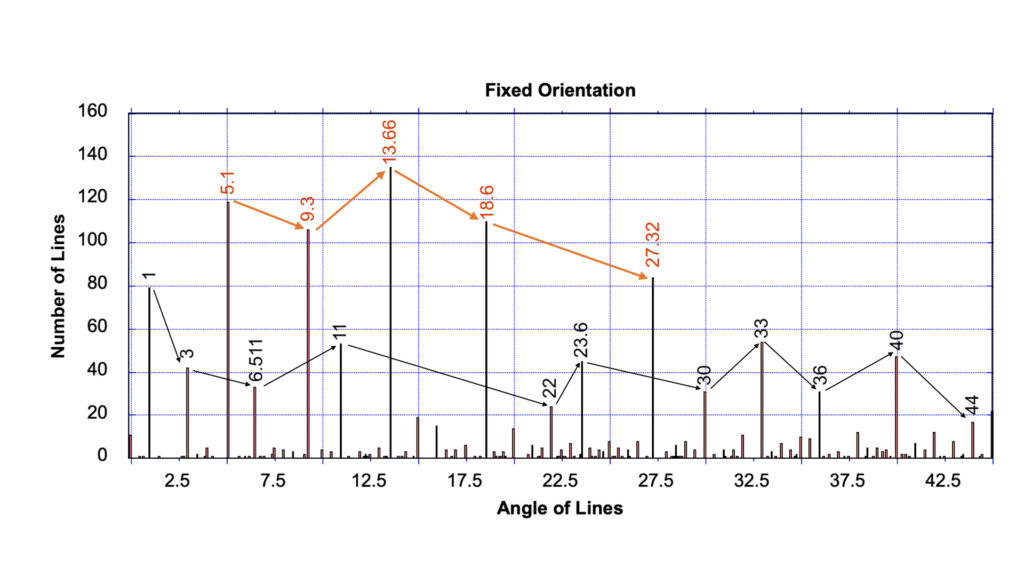
Fig. 1. Analysis of the angles present in 1432 lines in geometric lines found in portable “art” from various regions and various eras6.
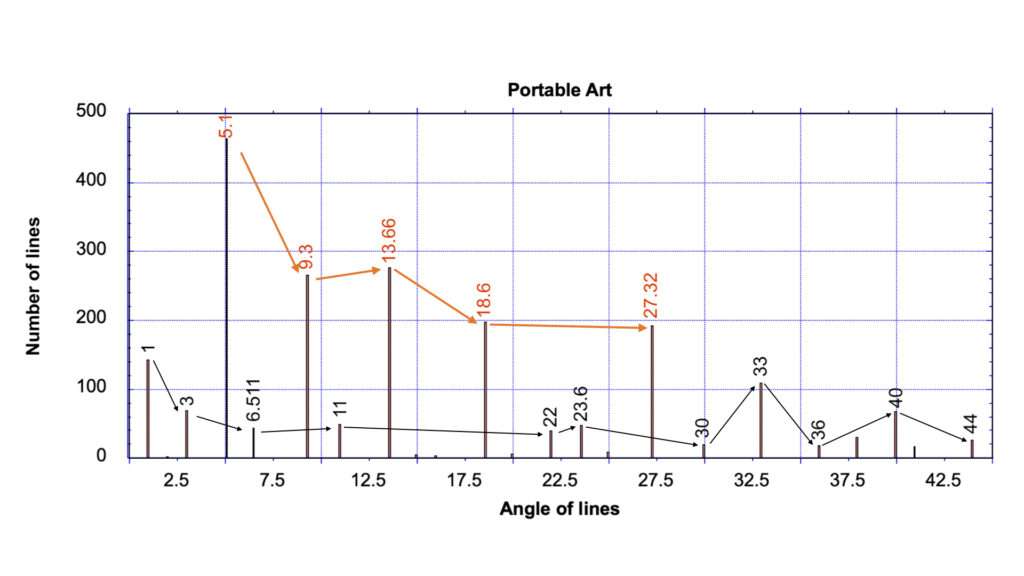
Fig. 2. Analysis of the angles present in 2106 lines in geometric lines found in portable “art”. These geometrical images were obtained from various regions and from various eras6.
Following the logic outlined in the prior study6, in combination theory, in a system where there are only 15 peaks, the probability for 5 pre-selected angles (these being the lines at 5.1, 9.3 and 18.6 degrees, and at 13.66 and 27.32 degrees) to appear by chance is equal to just 1 in 3003 occurrences . In combination theory this is equivalent to 15C5, which is equivalent to a p-value of .0003. This is below the .05 value that is usually considered the cut-off value that is used to mark a result as being statistically significant in medical trials, and iti is also below the .01 level that is sometimes employed in physics and computer science.
However, here the interest is in the overlap with the portable geometric images. Traditionally, the intent-theory (this being the theory that the lines are drawn to astronomical values) has been rejected because the general opinion amongst those looking at this idea is the data is probably influenced by experimental bias in the analysis of portable image. This is because the images (in the portable class) can be rotated until a “best” fit is obtained. Thus, the task here is to now determine what is the actual effect of forcing the angles to fit the proposed theory is in the worst case scenario, and to determine if the probability p-value is still below the usual accepted cut-off value of .05.
For the portable geometric group, in this test to account for bias it was assumed that up to three of the five most common angles in the portable study were “forced” to align to the 5 most common peaks that were seen in the static fixed-orientation study – the static images cannot be rotated, thus the angles seen are not subject to experimental bias.
This means it can be argued that the person undertaking the study of the portable images has tried their best to force the result so that up to three of the peaks dominate the returned data, and in this case these three peaks must belong to the group (5.1, 9.3, 13.66, 18.6 and 27.32 degrees).
This means, if the null-theory is correct (this being the theory the lines are just a random array), then only the last two peaks in the data set should be entirely random, this is because it would be very difficult to force all five lines to intentionally align to the same five values if the pattern was indeed random, and if all five values did align by chance, then according to statistics the chance for this to happen can be calculated as 15C2.
When this probability is calculated out, this 15C2 probability is found to equal to 105 combinations. Thus, if this study was undertaken 105 times, there is only 1 chance that, by coincidence, the two graphs should overlap. At a p-value below .01 this is considered to be statistically significant, and argues that it is 99% likely that the graphs were made to intentionally align to these specific angles. However, that is not the final value,
There was one secondary parameter in this analysis, and that was a requirement that the lines must also aligned to the left and right of vertical and also to above and below the horizontal. In other words, there exists a four-fold symmetry within these ancient diagrams.
When the probability foru four-fold symmetry is included, for the last two lines to overlap and for the two datasets to create two identical distributions (see Fig. 1. and Fig. 2), the probability for just the portable system aligning is now 1 in 121,550,625. This equals a p-value of 8.23×10⁻⁹, which is now well below the .01 level that is considered to mark a result as being statistically significant. This value also is below the 6-sigma standard used in high-energy physics.
This result argues that, based on the statistics observed, it is far more likely that these ancient lines were created, with deliberate intent, to match these specific angles, and it is thus very unlikely that the lines are a random array.
The results also argues that the perception that these results have been negatively influenced by experimental bias is incorrect. Even though there is the need for the person to rotate the image to obtain the best match to the proposed intent-model, this does not affect the conclusion.
For the fixed orientation images, in which there was no experimental bias, with the angles of the five lines being offset to both above and below the horizontal axis and to the right and left of the vertical axis, the four-fold symmetry reduces the probability for the fixed-orientation study to align to these specific five angles from 1 in 3003, which is already statistically significant, to 1 in 8.13 x 10¹³. This generates a p-value for just the fixed orientation group at 1.2×10⁻¹⁴.
When these two independent groups (the data from the fixed-orientation and portable images) are combined to determine the combined statstical chance for the two groups to show an exact overlap to just these five lines (the secondary 11 lines, which also match will not be included in this study, but would reduce the probabilty further), the probability that the overlap is only because of chance is calculated to drop to 1 in 9.89×10²¹. This is equivalent to a probability p-value of 1.011×10⁻²².
Though this number, is substantially lower than the 1.08×10-46 value that was generated by assuming an error of ±0.5°, this is still low enough that in most studies it would be considered reasonable to round the value to zero. A p-value of zero argues the null-hypothesis has failed; which, in this case, means the angles drawn by lines in ancient geometrics cannot be random.
If the lines are not random, even in this worst-case scenario, then the lines must have been designed with intent, and because the angles do match well-known astronomical values (amongst the five most common values seen there are two sets which show half-values) this argues the lines are not “protowriting”, as claimed by Genevieve von Petzinger2, they are, instead writing.
They contain very specific information that links to astronomy. The same information (the same marks) are found worldwide, over a long extended timeframe, and the presence of four-fold symmetry can be used to create an alphabet. In the author’s prior studies, a preliminary phonetic code was extracted, using a mix of ancient language that are all based on archaic linear texts5,7.
Discussion and Conclusions
This study shows that even when the error bars are increase to a worst-case scenario, the overlaps seen in the collected data cannot be explained by the patterns being random.
References
- Bennett Bacon; Azadeh Khatiri; James Palmer; Tony Freeth; Paul Pettitt and Robert Kentridge, An Upper Palaeolithic Proto-writing System and Phenological Calendar, Published online by Cambridge University Press: 05 January 2023 DOI: 10.1017/S0959774322000415
- Genevieve von Petzinger, The First Signs: Unlocking the mysteries of the world’s oldest symbols (Simon and Schuster).
- Email communication with Genevieve von Petzinger.
- The Map That Talked, CreateSpace Independent Publishing Platform, first published Nov 2012, current edition published 2018.
- The Babel Texts, CreateSpace Independent Publishing, 2018
- Derek Cunningham, New Study Reveals Stone Age People Could Read – and were Homo sapiens the first species to learn to write?, Babel Texts Research Letters, February 25, 2024.
- Derek Cunningham A new look at the Babel Text on the Lingjiatan Jade Eagle Part I: Is this the Earliest Written Names of the Planets, The Babel Text Research Letters, March 9, 2024.


