Abstract – In prior studies of Stone Age geometric patterns, the author has claimed that the lines found in ancient religious and astronomical sites might be encoded text. In this linear text it is proposed that the hidden meaning is the angle of the line reflects specific astronomical values, and when it was used as an early alphabet, the direction of the line was anciently used to represent the sound of a consonant and the direction of the line was used to add the sound of a vowel to the consonant. In this way, it is proposed that the oldest alphabet was similar to the modern day Japanese Hiragana and Katakana alphabets. Obviously this claim has been met with strong resistance, and most archaeologists are still of the opinion that the ancient patterns found in various Stone Age settings are just random doodles, and they have also argued that the only reason why the patterns appear to show any consistent behaviour in the angles they contain is because experimental bias is present in the studies. So, to answer these potential issues, in this study a new review was undertaken that removed all experimental bias from the study. This is achieved by comparing the angles present in large geometric patterns that are fixed in their orientation with smaller geometric patterns that can be rotated. Using statistics, it is found that the probability p-value for the two datasets to be identical is 4.56×10-40, which is far less than .05 cut-off, which is normally used to determine if a result is statistically significant. This argues that the chance for these Stone Age lines being random is so low, it is more likely to be able to deliberately toss a coin eleven times in the air, with the aim to land the coin on its side each time. This also means it is now reasonable to argue the currently accepted Null Theory (which states all Stone Age lines must be random patterns) is disproven. In other words, these archaic patterns were constructed with deliberate intent. The presence of deliberate intent can only suggests meaning, and when contextual meaning is present in a written mark, it can then be argued the marks must be a form of text. The angles present in these lines are also found to be consistent with astronomical values, with the five most common anglers being linked to the measurement of time and and the prediction of solar and lunar eclipses.
Author: Derek Cunningham
Introduction
Are Paleolithic-era geometrics an archaic way to communicate through mathematics and astronomy, in which the angles draw the astronomical values that are central to measuring time1,2, or are they a form of “pictorial writing with as yet uncertain meaning”3,4; or are they, as most would contend, just random doodles, with no true meaning5-13.
In order to test this theory, which argues these ancient linear images were designed deliberately, and they are linked to the measurement of astronomical values1,2,14, a statistical test was developed in which known geometrical images were divided into two independent groups. In the first group, a graph was compiled from all the angles observed in large static images, these being the images present on the walls of caves; on large buildings, such as temples, or on other objects that are far too large to be rotated by hand; and, in the second group, a similar graph was obtained for all the angles present in portable art1,2,14,15.
By dividing ancient images in this way, it is now reasonable to predict that if the Null Hypothesis is correct, and these ancient patterns are random, and various different people drew them separately as artistic doodles or simple patterns, there should be no overlap between the data obtained from these two separate groups. However, if the data from these two groups are reasonably identical, which means the calculated p-value is less than .05, it can then be argued that the angles present in these lines were designed to hold meaning (in other words, they were created with deliberate intent), and they must then be considered the earliest known texts.
Experimental Background
Though many believe it would be difficult, if not impossible to develop a mathematical test that could determine the intent behind Stone Age art, in this case it can be argued if the ancient images are based on astronomy, then because astronomy is linked to mathematics, then the nature of the angles present within the images should be able to reveal if these early geometric images were designed to contain astronomical context and meaning1,2.
In this theory, it is proposed that because earliest Stone Age era astronomers had no systematic method to record their observations (in the earliest days they had no written text) they may have chosen to simply convert their astronomical values to a series of simple lines, as a type of shorthand, in which the astronomical value was recorded by the angle at which the line was drawn.
This link to angles is reasonable, because the observation of astronomical objects is closely linked to changes in the angles between the horizon and the object being studied.
However, it should be noted that the amount of information that can be stored in this simple code is limited. Thus, over time, there would be the motivation to improve upon these symbols, and it is proposed that these early astronomers chose to modify the system to create a basic alphabet.
In this alphabet, the scribe would set a phonetic sound to the angle of the line2. But that alone would still limit the structure of the alphabet and it would still not generate enough useful sounds, if you wanted to be able to create a functional alphabet. Thus there was a second modification made, where the lines were offset as angles to both the x and y axes2.
Though this process now has the effect of limiting the angular values present in an images to between 1 to 45° (the lines to the left of vertical will overlap with lines aligned to above teh horizontal at 45 degrees), which would seem to limit the range of astronomical values that one could be recorded by this system, the major advantage is this now allowed the lines to be drawn in four different directions – in other words, as an angular offset to above or below the horizontal axis; or as a line offsets to the left and right of the vertical.
In this way, the angle of each line can now be given a specific consonant, such as s, g, n, or p, and the direction that the line was offset to can now be linked to a vowel, with the four vowels being a, e/i, o and u. These vowels are then attached directly to the consonant, which creates an alphabet that is similar to the Hiragana and Katakana alphabets, which are used today in modern Japanese. For example, in Japanese the consonant K is not pronounced alone, but is pronounced as Ka, Ki, Ku, Ke or Ko. Here the only difference between the modern Japanese alphabet and the porposed Stone Age alphabet is the two vowels I and E are combined together, in the more ancient alphabet.
In this way just eight simple lines (drawn at eight different angles) can now be used to create a 32-letter alphabet2, and this is sufficient to create a written language. With five lines (equally space in each 45 degree block) there would be 20 letters. The proposed alphabet and the phonetic values extracted from studies linked to a unique Chinese astronomical tablet is shown below.
In this current statistical study, the preliminary assignment of which phonetic elements are attached to which lines1,2, will not be reviewed (again, see the above video). A phonetic study would require further in-depth studies of the various early linear texts and languages.
Instead, the aim is to only determine if the angles present in geometric images are repeated in a consistent manner, and whether this consistent patter appears in all regions around the world, and also if the same geometric patterns were created in many different time periods.
This is very important, because if these ancient geometric patterns fail to align in a consistent manner to the angles that have been previously claimed by the author to be critical to the theory, it would then follow that there can be no link to the proposed syllabic alphabet, and if that is true, then all other connected arguments would fail. This is thus a very difficult test, and failure here would nullify all the author’s prior studies.
This makes it is is very important to determine if the angles present in geometric patterns (specifically images recovered at known religious sites, or those that have a well-documented history that links them to a known astronomical site) are reproducible.
Within this test, the geometric images are first divided into two independent groups, and then the angular distributions contained within each group will be reviewed to determine if the results are identical.
In this case, the division is not random, but is instead achieved by dividing the images into two distinct groups, which are separated by the ability of an observer to rotate the image.
Thus in one group the study involves analysing the angles present in geometrical images that are incapable of being rotated, which means the angles must be studied as is; and within the second group the angles are recorded from images where the pattern can be freely rotated.
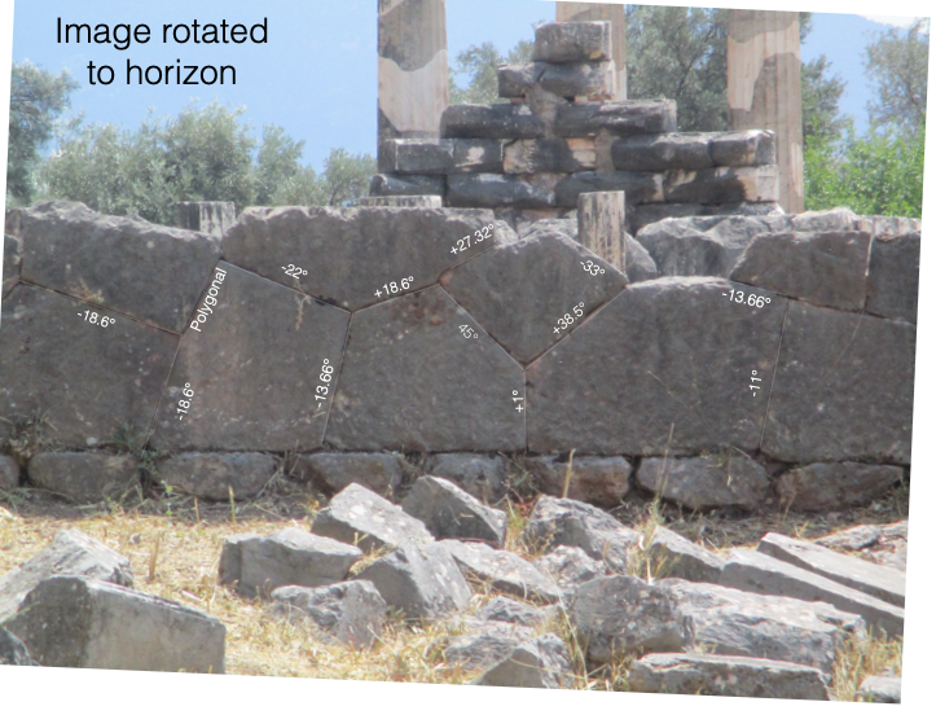
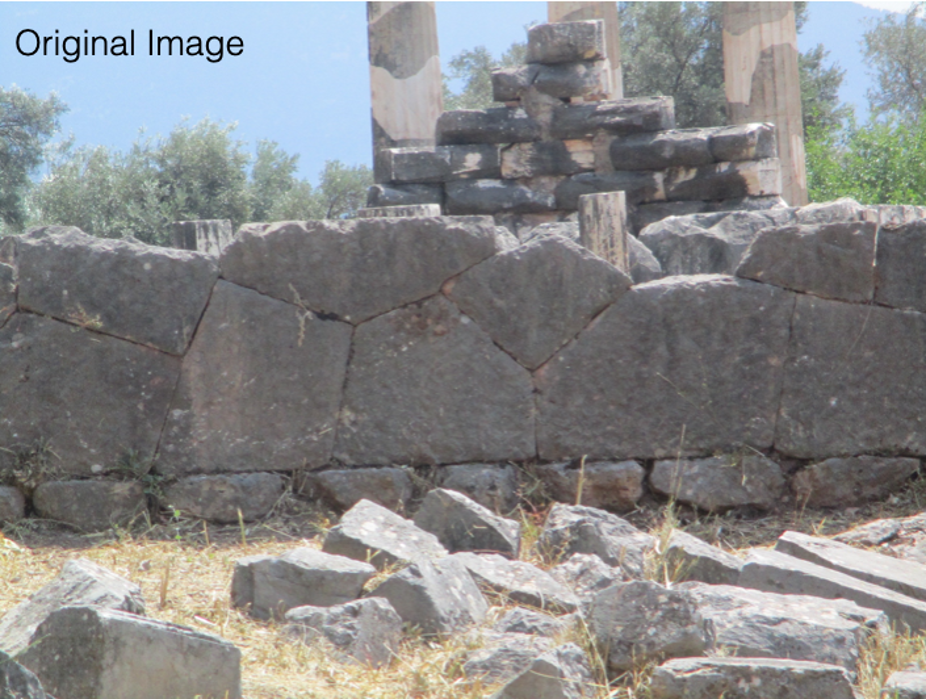
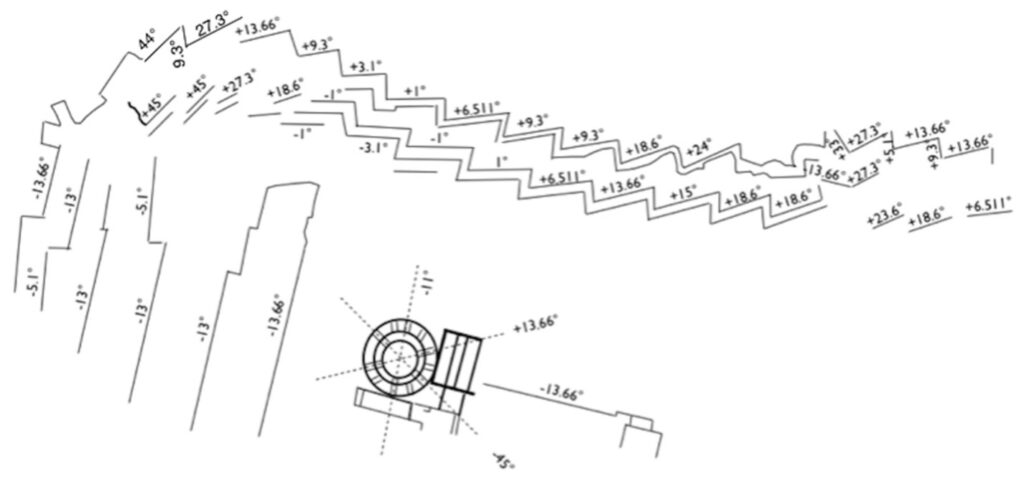
In order to better understand this, one example of a geometric pattern that cannot be rotated (except by a small amount to account for the movement of the Earth due to earthquakes) is shown below. This specific image was taken by the author, and it is from the Temple of Athena in Delphi, Greece. As can be seen, after the structure is rotated so that the wall is horizontal, and the pillars of the temple are upright, the angles present in the lines formed by the polygonal walls can be measured. In some of the lines (the lines set to plus and minus 18.6 degrees there appears to be the presence of four-fold symmetry, with the lines aligned to above and below the horizontal and to the left and right of vertical. A similar trend is also observed in the lines set to circa 13.66 degrees, which in this model is a value linked to the half-sidereal month. The full duration of the sidereal month is 27.32 days, which appears in one line in this image.
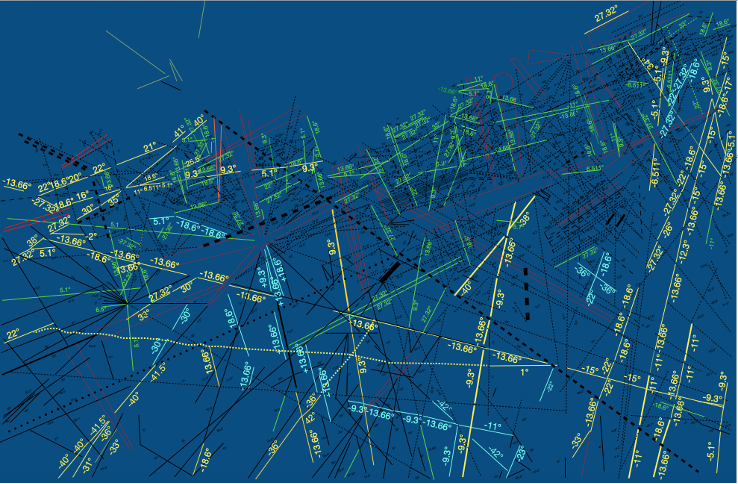
Other examples of geometric patterns that cannot be rotated are below the ground lines present at Nazca in Peru, and the layout of the polygonal walls at Saksaywaman Temple, also within Peru. Again the same range of angular values are apparent. The structure of the lines present in the Nazca lines will be discussed separately in a later paper.
For this experiment, it is important to note that for the smaller, portable images there is no obvious marker in any of the images that could permit an independent observer to determine the original orientation for the image. In fact, many portable geometrics appear to have been deliberately destroyed, and all we are left with (in most cases) are small fragments. This problem was noted by Peter Underhill in 201316 a researcher in anthropology at Stanford University, in early discussions with the author. This means that, for the images present in the portable group, the person tasked with trying to determine which angles are present in the image will be forced to use their own intuition to determine how the patterns should be orientated to generate the best match. This is where experimental bias will occur, and why great care is required to remove this bias from the final analysis.
In this case, each sample was repeatedly rotated and reanalysed and the final results for each rotation compared, until the best match was obtained. The bias is then removed, in the experiment, by then arguing that this inherent bias will only affect at most the three most common angles seen. This is because, on average, the optimisation was undertaken by a review of the three most common lines. The fourth and fifth most common angles are usually present in smaller numbers and in the more complex images the fourth and fifth most common values are often lines with various different potential meaning. Thus, in the protable group the analysis will only involve the study of the fourth and fifth most common angles, which should, according to the Null Hypothesis, be entirely random.
Finally, except for where it is specifically noted in the text, all results have already been published by the author, prior to this study, and their distributions cannot be changed1,2. This acts as a barrier, to prevent any secondary bias from entering the experiment, which may be caused by an attempt to reanalyse the various datasets after the fact.
In practice, because it was previously argued by the author that eight angles tend to dominate these early geometric patterns1,2, with five angles being more prominent than the other three, the physical process of studying portable/mobile images depends on how these lines align in four-fold symmetry, coupled with the need to balance a circa 9 degree gap in the angle of the lines that occurs between the two highest angle lines, these lines occur at circa 18.6 and 27.32 degrees and they represent the 18.6-year lunar cycle and the 27.32-day period of the sidereal month. There is also a need to align these sample, in order that the entire alignment also optimize the appearance of their respective half-values (these being lines at 9.3 and 13.66 degrees, which represent the half-values of the just mentioned lines at 18.6 and 27.32 degrees).
Within astronomy, these half and full values of the sidereal month and lunar cycle are actually very easy to observe in the night sky, as they are marked by their simple change in moonrise from the northeast to the southeast. In the case of the sidereal month this occurs each 13.66 days.
It is this visible transition that makes the sidereal month useful in measuring time, and for calculating Earth’s exact location in space. In total there are 366 sidereal days, in Earth’s 365 day orbit of the sun. The additional rotation of the sidereal day originates from the the need to add exactly one circumference of the earth in the orbit of Earth around the sun. This being related to the famous puzzle that asks how many times can a coin rotate around another coin of the same diameter in one single rotation.
It is also important to optimize the number of lines at circa 5 degrees. This line is also seen in many ancient geometrics and it is thought to reflect the importance of the angle of the moon’s orbital plane with respect to the Earth, which is a value used by astronomers to both calculate the motion of the moon through the sky each night; and to calculate when solar and lunar eclipses will occur. The other possibility is the number five may relate to the number of visible planets that can be easily seen from Earth. In the context of this study, the explanation for this line is not important.
Finally, it should be noted that in the author’s prior studies1,2 there is no claim that any of these archaic images were constructed to an accuracy of 1/10th, or 1/100th of a degree, such that the 27.32 day sidereal month must be recorded by a line that must be drawn exactly, at 27.32 degrees. That accuracy would be impossible to achieve in ancient geometric images. The only claim that is made is the angles created by the lines in geometric patterns can reasonably represent these astronomical values. In other words, the alignment seen in these geometric images are approximate.
It was also decided that this analysis should be limited to images that had previously been published by museums, or those which had previously been published in science journals, or from images where the published data could be reasonably confirmed. In general, this means the photograph should be recorded with the camera perpendicular to the geometric pattern. However, because the distance to the image and the type of camera lens used in taking the photographs has not been recorded, in many cases, only the central part of each image should be considered to be reliable.
In terms of accuracy, it was also found that in the very best images the lines are accurate to ±0.1 degrees. In the poorest quality images the accuracy was in the order of ±1 degree. The overall accuracy of the lines was more dependent on the length of the lines than the width of the lines, with longer lines being far more accurate. On average, the accuracy of the lines was circa ±0.5 degrees.
In terms of the statistical, any distortion in the angle of the lines cause by camera lens distortions will only act to aid the null hypothesis. This because this effect will increases the probability that some lines with be incorrectly recorded and identified as being “random” in angle. This means, at the outset, the experiment is initially tilted against the proposed astronomical theory, but as will be seen, this problem was found to not affect the final analysis, nor does it affect the final conclusion.
The list of geometric images considered to be portable include, from China, an engraved pattern on a circa 5,500 year old Jade block from Lingjiatan, which is known by Chinese historians as the earliest pictorial Chinese description of Heaven and Earth (this early geometric item, with a known contextual meaning, is from the National Museum of China collection in Gansu; a 5,500 year old Jade “Eagle that is marked by a central geometrical pattern that is considered to be an early representation of the sun17; from the Shuangdun, Bengbu site, four geometric images found on plates 92T0722(28):40; 92T0722(29):51; 91T0819(19):171; and 92T0721(29):3618; two circa 5,000 year old marked axe head fragments from the Liangzhu archaeological site that exhibit linear marks that some have previously argued are consistent with very early Chinese texts19; a geometrical pattern drawn on a Qijia culture Bronze mirror that is dated to circa 4000 year old; the linear early Chinese texts found on Oracle Bone R044284, which was recovered in Pit YH127 from The Ruins of Yin20; and a 14,000 year old marked stone from Pit 1 of the Shuidonggou archaeological site21; from Germany two circa 350,000 year old marked elephant tibia from the Bilzingsleben archaeological site22; from the UK, the lines drawn by the Bush Barrow Gold Lozenge23, the lines present on the Stone of Scone (for this study a detailed image was obtained from Historic Environment Scotland), and the lines found on a statue called the Orkney Venus; from the Czech Republic the circa 30,000 year old Dolní Věstonice wolf bone; from the Meuse Basin in Belgium the Remouchamps bone, which is believed to be between 10,000 to 12,000 years old24; from Patne, in India the linear pattern drawn on an engraved egg9; from Africa a multi-lined star type image drawn by the San Bushmen25; from the Democratic Republic of Congo the circa 20,000 year old Ishango Bone, this bone has marks that the late Alexander Marshack, of the Peabody Museum of Archaeology and Ethnology identified as representing a 6 month calendar; and from South Africa the linear pattern found on two engraved eggs from the Diepkloof Rock Shelter collection26,27; a marked stone recovered from the Wonderwerk Cave, and a marked pebble also recovered from the Wonderwerk Cave10,28; a marked stone from Klein Kliphuis29, a marked stone from Klasies River Cave; and three circa 70,000 to 100,000 year old engraved stones recovered from Blombos Cave, these being identified as Blombos M3-1, M1-5, and M1-6 from the studies undertaken by d’Errico, Henshilwood and Nielsen30-32; and from the Lebombo-Border Cave a marked, circa 43,000 to 44,200 years old Baboon fibula (this was discovered in the 1970s by Peter Beaumont, who later identified the markings as being an early lunar count); and two 24,000 year old Lebombo (Border) Cave notched wooden sticks, which have been identified to be coated with poison31,32. See Cunningham1,2 for the prior studies and the angles present in each of these samples.
The fixed-orientation patterns are; from Peru the Nazca ground lines from all eras of its construction (see Fig. 2), and the angular distribution drawn by the polygonal walls at Sacsayhuamán relative to the cardinal axes (Fig. 3); from the UK, the angle between neighboring Aubrey Holes, Y Holes, and Z Holes at Stonehenge (see again Cunningham 2012 and 2018); from Greece the angular distribution observed by the various walls within the Acropolis relative to the cardinal directions; and from France the angles present in the geometrical images found at Lascaux Cave, these were recorded by the Musée d’Archéologie Nationale, as part of the ongoing attempt to record and preserve the various Lascaux images.
Also considered to have a fixed-orientation but the images were permitted a small degree of rotation, to account for ground movement, or small potential errors in camera alignment are; from Delphi in Greece the Polygonal wall under the Temple of Apollo, and the polygonal Wall in front of the Sanctuary of Athena33; in Athens a short polygonal wall found at the base of the Temple of Hephaestus in Agora34; in Australia the various geometric patterns found at Carnarvon site, and the geometric images found at the Perminghama Petroglyphs; in America the Anasazi Ridge petroglyphs, and the V-bar-V petroglyphs located in the Sedona Red Rock region; from Tibet a Mascoid with the image supplied from the collection of John Bellezza; from Egypt the linear pattern surrounding an image called the spider, which was found on a wall at the Kharga Oasis; and finally from Hawaii the Olowalu Petroglyphs.
Results & Discussion
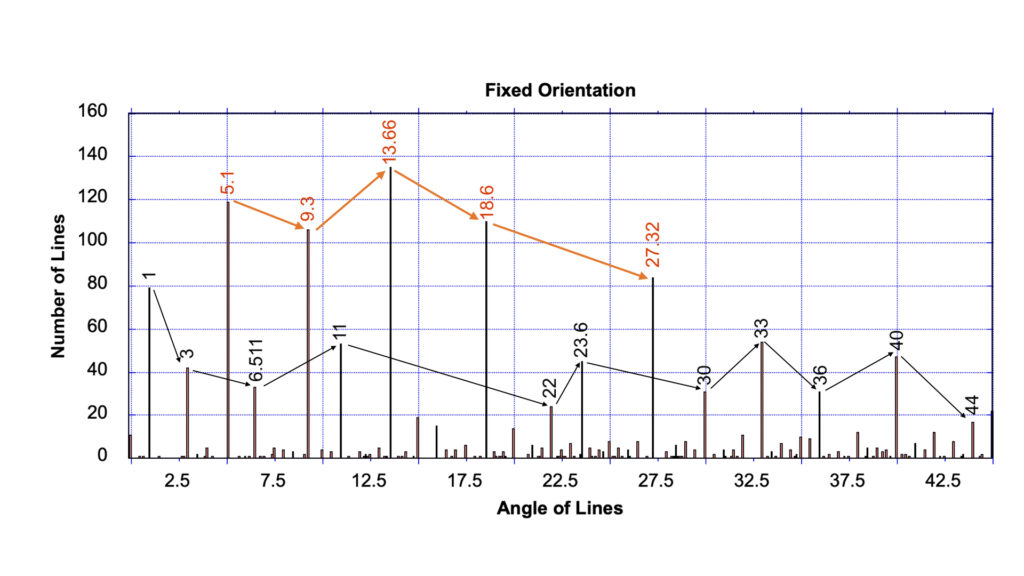
In the geometric patterns that are fixed in their orientation (see Fig. 1 to 3 for examples of the patterns observed), five angles dominate (Fig 4a). In total 1432 lines were analyzed in the fixed-orientation group. Below the data for the fixed orientation group is shown beside the data from the portable “art” group.
click on image to enlarge
The five most common alignments are lines at circa 5.1 degrees; at 9.3 degrees and 18.6 degrees (which are angles that correspond to the half and full 18.6 year lunar cycle); and at 13.66 and 27.32 degrees (which corresponds to the half and full sidereal month). In the proposed, Null-Hypothesis (the Null Hypothesis again being the Random Line Hypothesis) it was argued that these five angles should not be highlighted just by chance, as the dominant group.
In total 119 lines appear at circa 5.1 degrees (which is equivalent to 8.31% of all lines studied in the fixed-orientation class), there are 106 lines at circa 9.3 degrees, 110 lines at circa 18.6 degrees, 135 lines at circa 13.66 degrees, and 84 lines at 27.32 degrees. These numbers are between 2.6 times to 4.2 times more frequent than expected for a random array.
Though 878 lines (61.31% of the total) could be considered to be randomly aligned, it was found that amongst there 878 lines 685 of these lines were from the Nazca site, which was by far the largest site studied.
Because the Nazca lines contribute so many lines to the fixed-orientation study, a more detailed analysis of the Nazca lines was undertaken. From this it was found that not all the lines at Nazca are equivalent. For example, from photographs of the actual lines there are 102 lines that appear to be dashed, and 28 lines that appear to be small paths and are not usually included in the study of Nazca, because they are thought to be trails. Within these two specific groups 55 (53.9%) of the dashed lines and 20 (71.4%) of the “path” lines were found to be consistent with the proposed angular theory. This contrasts with only 160 of the more prominent (more famous) lines (which is only 23.4% in this group) being consistent with the proposed theory.
When compared to the other geometric images from the fixed-orientation group (see Table 1 and 2), the data from the Nazca “famous” lines can be considered to be an outlier. The next sample with a poor overlay is the Olowalu Petroglyphs in Hawaii at 30.51%, and Carnarvon at 47.06% See Cunningham1,2 for source data. All other images studies reveal more than 50% of their lines are aligned to just these five angles. This could suggest the famous Nazca site was constructed in two, or perhaps three distinct stages, with the most prominent pattern (which is the pattern that shows the lowest match to the proposed astronomical-alignment theory) being perhaps the most recent stage in the development of the Nazca pattern.
Amongst the other angular values present, the sixth most common angle occurs at circa 1 degree, with 79 lines (or 5.52%) aligned to this angle. This is then followed by four lines that are aligned to circa 11, 23.6, 33, and 40 degrees, which each have between circa 45 to 55 lines. These secondary values, with the exception of the 40-degree line, can all be easily assigned astronomical meanings.
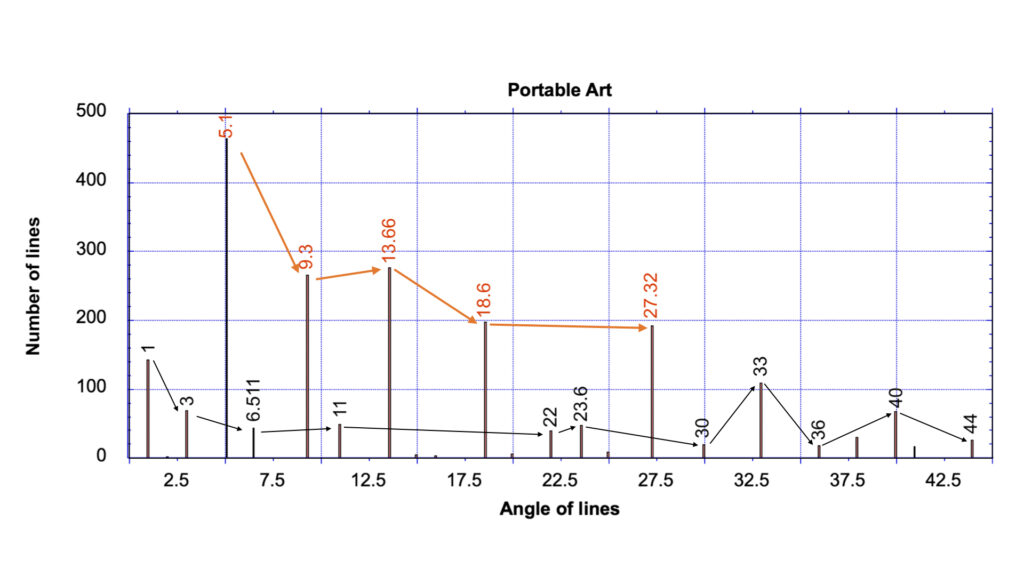
Turning now to the results from hand-portable samples, there were 2106 analyzable lines in this group (see Fig. 4b).
The most obvious result is despite the prior concerns over lens-induced, image distortion, which had the potential to swing the data in favor of the Null Hypothesis, the exact same five lines were still found to dominate; with the highest frequencies occurring within the angular distribution at circa 5.1, 9.3, 18.6, 13.66 and 27.32 degrees.
Within the study of portable images, there are 464 lines at 5.1 degrees, 266 lines at circa 9.3 degrees, 198 lines at circa 18.6 degrees, 277 lines at circa 13.66 degrees, and 192 lines at circa 27.32 degrees. These numbers are between 4.14 times to 10.02 times more frequent than that expected for a random array.
To compare these two datasets, using statistics, the first step was to calculate the number of possible combinations that can arise from 45 isolated peaks (each with a base accuracy of circa ±0.5°); and to then determine the statistical probability that the same pre-selected group of five angles (which were pre-chosen for their astronomical significance) will dominate, in both the fixed-orientation study and the portable-geometric study.
From combination statistics, this is a straightforward calculation, and it can be calculated to be equivalent to a 1 in 1,221,759 chance (from 45C5). This, in probability terms is equivalent to a p value, of 8.2 x 10⁻⁷, where a p value of .01 represents a 1 percent chance that the lines are random. A value of 1 would indicate it is 100% certain that the lines are random, and in medical trials a p-value of .05 is the standard value used to mark a clinical trial as being successful or statistically significant. As can be seen the value in this specific test is well below this boundary.
However, this is not the final p value. This is because the 8.2 x 10⁻⁷ p value does not take into account the requirement that the same angles were drawn along four separate directions (that is the lines are offsets to above and below the horizontal and to the left and the right of vertical).
In this case, these four directions can be considered to be four independent datasets. Thus, it is more accurate to say that the probability for these five lines to dominate in the fixed-orientation in all four directions is actually 1 in 2.2 x 1024, which is equivalent to a p value of 4.49 x 10⁻²⁵.
As this p value is exceptionally low, this value can already be used to argue that that these geometric lines were drawn, intentionally, to these specific angles, and the lines are not random.
But there is another parameter that must be included. The calculation of the final p value must also look at the common overlap that can be seen between the portable-and fixed orientation images. These being the two independent studies that were considered crucial for removing bias from the analysis of the portable “art” images. (see Fig 4a and 4b).


click on image to enlarge
Because the portable sample involved a pre-selection process, which, for the purpose of this statistical study is assumed to have pre-chosen three of the five primary peaks observed (note this is actually a high estimate, because in reality the process for aligning portable images usually only employed two of the five peaks in the optimization step), this means, for the portable image study, it is only necessary to calculate the probability that just the last two (out of five) peaks will, by chance, match the proposed five-member series.
This means, in the portable image study, the combination statistics is calculated from 45C2, which is equivalent to a 1 in 990 probability for a single angular range.
In terms of probability this generates a p value of .001, which marks this results alone as being statistically significant, but when this is again modified by the fact the same angles appear in four independent directions, the final probability for this overlap to occur in the portable study is just 1 in 9.6 x 10¹¹. This equals a p-value of 1.04×10⁻¹².
When the combined p value is calculated for the two independent studies overlapping, the calculated p value is then 4.67×10-37, but this is still not the final p value. This is because, as mentioned earlier, this study is not limited to just five peaks. In this specific study, the interest is in the behaviour of the 16 most common peaks, these being the values considered to be either linked to astronomy, or to geometry, or are seen in above average numbers in prior studies of these ancient geometric patterns1,2.
As can be seen here, the various peaks do have different numerical frequencies, but what was unexpected is the manner in which they vary, (see again Fig. 4a and 4b).
The unexpected result, and this is the first time that this feature has been observed is the two independent studies show a long, extended series of common increases and decreases, between the various primary and secondary peaks. In total there are four common variations in the five primary peaks and there are ten common increases and decreases between the eleven secondary peaks that were recorded.
The mathematical relationship between the peaks has been discussed in previous studies by the author, in terms of astronomy, but in terms of phonetics, these common oscillations now appear consistent with standard linguistic theory, which argues some letters (or sounds) will appear more often than others, in both the spoken and written languages.
In terms of statistics, the probability for this similar repetition to occur in the sequential magnitudes is just 1 in 1,048,576, this being calculated for the 10 common increases and decreases in numerical frequency amongst the secondary angular values; which means, when this probability is combined with the other prior statistical odds, the p-value for these images being random now drops to just 4.45×10-43. If the analysis is extended to include the 5 most common peaks the probability reduces further to just 1 event in 9.2 x 1045, which is equivalent to a p-value of 1.08×10-46.
With the result being at this low magnitude, it was decided it had become unnecessary to further refine the data, as it is reasonable to round p-value of this magnitude to zero. In statistics this is rare, because a p value of zero implies the proposed alternative theory is proven, which in this case means the lines found in ancient geometric images were created with deliberate intent, and the Null Theory (which argues the lines are random) is disproven
Though this test does not use statistics to test the likelihood that these lines are linked to astronomy (as noted previously, this study only tests the probability that the lines are random), it is clear that there had to be an underlying motivation to create these lines to these specific values over such a long time period, and in so many different regions.
Because any conceivable motivations based on art are subject to change, people are driven to do new things and follow new fads, this argues that these archaic lines are based on observations that are fixed and unmovable, and it is clear, in this case, that these angular values do overlap with the values expressed by standard astronomical terms.
For example, the line at 11 degrees equals the 11 day difference between the lunar and solar year and the 33 degree value equals the 33-day reset value that is required to normalizes the lunar and solar year each three years, and the line at circa 23.6 degrees is equivalent to the angle of Earth’s axial tilt.
In addition, not only are the values consistent with basic astronomy, the proposed link to astronomy would give the motivation to use these values, unchanged, for thousands of years; because these values can be used by astronomers to predict lunar and solar eclipses. This is an ability that the astronomers and early politicians may have perhaps found useful; and this brings us to perhaps the most important observation.
The link to the story of the Tower of Babel is these astronomical images are found worldwide, and their appearance begin very early in what could be considered “modern” human history, with the three oldest studied geometric patterns being two circa 300,000 years old bones from the Bilzingsleben archaeological site, and one fixed-orientation image, of similar age, that is found on a wall at Rising Star Cave site, in Africa.
The intrigue is the Rising Star Cave is known to have been occupied by Homo naledi, but the same distributions in angular values can also be observed in sites that are linked to anatomically modern Homo sapiens; as well as within sites that were occupied by Homo heidelbergensis, and also by the Denisova hominins.
From this observation it is clear that further work is required, not only to determine who first made these ancient patterns, but to also determine if multiple species of human used the this archaic text at the same time.
References
- The Map That Talked, CreateSpace Independent Publishing Platform, first published Nov 2012, current edition published 2018.
- The Babel Texts, CreateSpace Independent Publishing, 2018
- von Petzinger, Genevieve, First Signs: Unlocking the Mysteries of the World’s Oldest Symbols Published. 2017
- Von Petzinger., G., and Nowell, A., A place in time: Situating Chauvet within the long chronology of symbolic behavioral development, Journal of Human Evolution 74:37–54 (2014).
- Bandi, Hans-Georg
- The Art of the Stone Age Forty Thousand Years of Rock Art, H.G. Bandi ed. Introduction, Holle & CO Verlag, Baden-Baden, Germany, 1961.
- Breuil, Henri The Art of the Stone Age Forty Thousand Years of Rock Art. H.G. Bandi ed. Pp 21 Holle & CO Verlag, Baden-Baden, Germany 1961.
- Bednarik, Robert G., Creating Futile Iconographic Meanings. http://www.ifrao.com/creating-futile-iconographic-meanings/.
- Bednarik, Robert G., The Earliest Evidence of Palaeoart, Rock Art Research 2003 20(2):3-28.
- Bednarik, Robert G. and Beaumont, Peter., Pleistocene Engravings from Wonderwerk Cave, South Africa, Préhistoire, art et sociétés: bulletin de la Société Préhistorique de l’Ariège, 2010, Pp 96 ISSN 1954-5045, Nº. 65-66.
- Halverson, J., Art for Art’s Sake in the Paleolithic, Current Anthropology, 1987 Vol 28(1):63-89.
- Halverson, J., The first pictures: perceptual foundations of Paleolithic art, Perceptions 1992 21(3):389–404, (1992).
- Ucko, Peter J. and Rosenfeld, A., Palaeolithic Cave Art, (McGraw-Hill, New York. 1967.
- Researcher Suggests Famous Ancient Inca Monumental Complex Exhibits Astronomical Values, Popular Archaeology, April 2014 https://popular-archaeology.com/article/researcher-suggests-famous-ancient-inca-monumental-complex-exhibits-astronomical-values/.
- Researcher says evidence of astronomical writing etched into Cypriot artefacts, Cyprus Mail https://archive.cyprus-mail.com/2014/02/02/17933/ [accessed 2023].
- Underhill, Peter., 2012 In-person discussions, Stanford University.
- Lingjiatan Culture Research, 凌家滩文化研究, 文物出版社, Lingjiatan Culture Research, Cultural Relics Publishing House 2006 [in Chinese].
- Shuangdun, Bengbu, Neolithic Site at Shuangdun, Bengbu, Kaogu Xuebao 考古学报 (Acta Archaeologica Sinica), 2007, 1, Pp 92-126.
- CBS News release, 2013, https://www.nbcnews.com/sciencemain/5-000-year-old-primitive-writing-generates-debate-china-6c10610754.
- Museum of the Institute of History and Philology, Taiwan (2018). This specific Oracle Bone is currently stored in the Museum of the Institute of History and Philology, Taiwan.
- Personal communications with Shuidongou Site Director Fei Peng, March, 2018.
- Sachsen-Anhalt collection, Image obtained from the Landesamt für Denkmalpflege und Archäologie Sachsen-Anhalt collection, 2018.
- The image of the Bush Barrow Lozenge used in the 2018 study was obtained directly from David Dawson, Director, Wiltshire Museum Collection. It should be noted there are many images online which show reproductions of the Bush Barrow Lozenge, which differ in the angular distribution from the original.
- Demoulin, Alain, the source image used in Cunningham2 was obtained from Landscapes and Landforms of Belgium and Luxembourg, Pp 125, Springer.
- Lewis-Williams, David., The Mind in the Cave: Consciousness and the Origins of Art, 2004.
- Wong, Kate., Engraved Ostrich Eggshell Fragments Reveal 60,000-Year-Old Graphic Design Tradition, Scientific America, Volume 302, Issue 3, March 2 2010: Observations.
- Texier P-J, et al. A Howiesons Poort tradition of engraving ostrich eggshell containers dated to 60,000 years ago at Diepkloof Rock Shelter, South Africa. Proc Natl Acad Sci 107:6180-6185.
- Thackeray, Francis., Personal communication, March 2018. The pebble reported by Peter Beaumont and Robert Bednarik is said to have come from Unit 4, Excavation 1, at Wonderwerk Cave.
- Mackay, Alex; and Welz, Aara., Engraved ochre from a Middle Stone Age context at Klein Kliphuis in the Western Cape of South Africa, Journal of Archaeological Science 35(6):1521-1532, doi 10.1016/j.jas.2007.10.015.
- Henshilwood, Christopher and d’Errico, Francesco, Middle Stone Age Engravings and Their Significance to the Debate on the Emergence of Symbolic Material Culture, Homo Symbolicus: Dawn of Language, Imagination and Spirituality Pp75-96 C. Henshilwood, and F. d’Errico, Eds., John Benjamins, Amsterdam 2011.
- d’Erricoa, Francesco; Banksa William E.; Warrend, Dan L.; Sgubine, Giovanni; Niekerk, Karen van; Henshilwood, Christopher; Daniaue, Anne-Laure; and Goñie, María Fernanda Sánchez; Identifying early modern human ecological niche expansions and associated cultural dynamics in the South African Middle Stone Age, PNAS July 25, 2017(114(30)):7869–7876, doi:pnas.org/cgi/doi/10.1073/pnas.1620752114.
- d’Errico, Francesco; Backwell, Lucinda; Villa, Paola; and Beaumont, Peter B; Early evidence of San material culture represented by organic artifacts from Border Cave, South Africa PNAS July 30, 2012 Vol. 109(33):13214-13219, doi:doi.org/10.1073/pnas.120421310.
- Author image, previously unpublished data.
- Author image, previously unpublished data..
2018


